Analyzing the Billboard Hot 100
I decided recently to indulge my interest in the US pop music charts. The most interesting is the Billboard Hot 100, which ranks singles in the US and is published weekly. Created in 1958, and with other similar data going back to 1940, it provides an interesting data set of manageable size (75 years * 52 weeks/year * 100 entries/week = around 400,000 total entries).
Trajectory of Singles on the Hot 100
Let’s start by plotting the paths a few hits took on the chart. In each graph, the x-axis is a date, and the y-axis is the rank on the Hot 100.
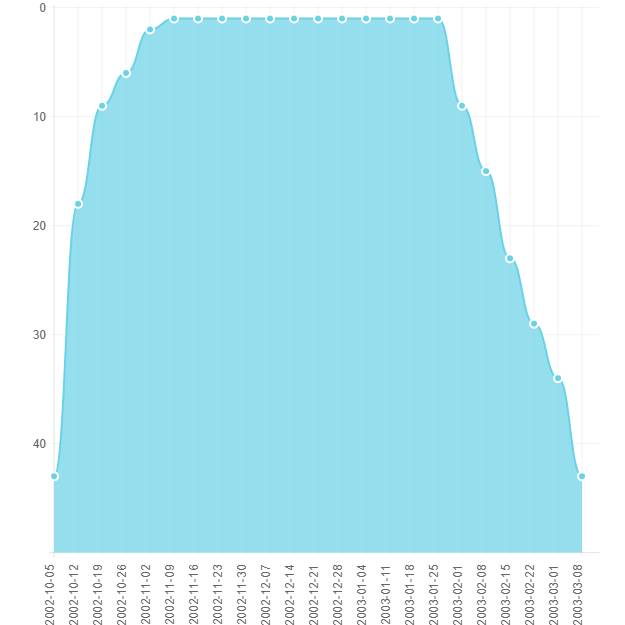
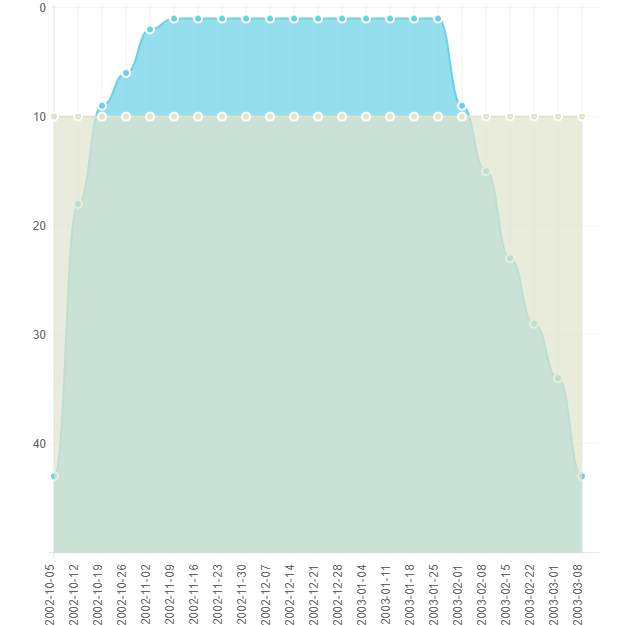
Lose Yourself – Eminem
Released in 2003, this track follows what I found to be a typical pattern for pop hits – a rapid rise, a period on top, followed by a rapid decline. Lose Yourself had a 12 week reign at #1 which ties it for 4th longest all time, but after leaving the #1 spot it dropped off the charts quickly.
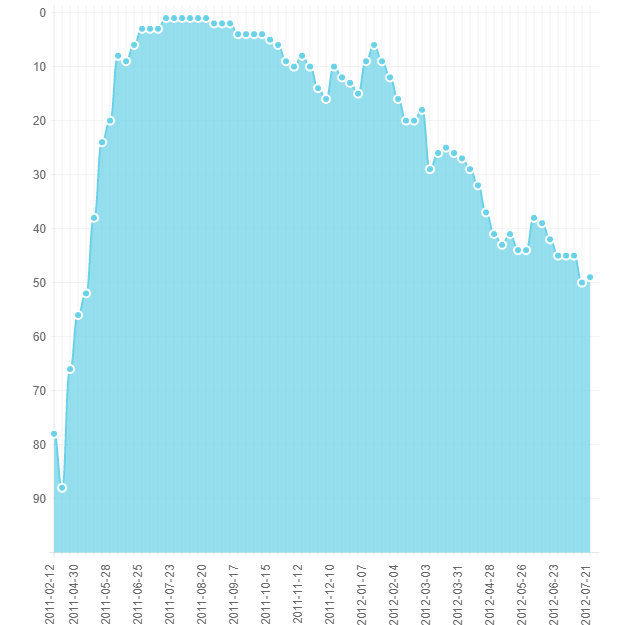
Party Rock Anthem – LMFAO
From 2011, this track spent only 6 weeks at #1, but an incredible 29 weeks in the top 10 (longer than the entire chart run for Lose Yourself), and 68 weeks on the Hot 100. Compared to ‘Lose Yourself’ this single had remarkable staying power.
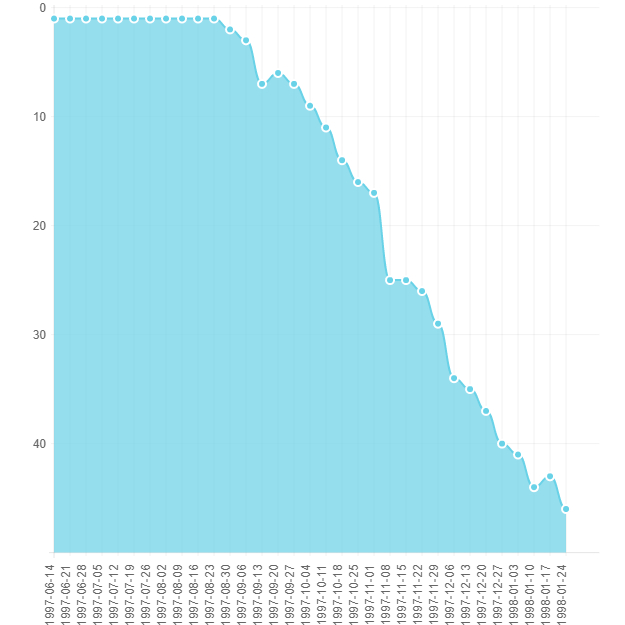
I’ll Be Missing You – Puff Daddy & Faith Evans featuring 112
Some singles don’t need time to rise to the top of the charts. Released in 1997, this is one of only 22 singles ever to debut at #1.
Beatles dominance in 1964
In 1964 The Beatles totally dominated the Hot 100. On one graph, here are all Beatles singles to chart from 2/1/1964 to 6/1/1964:
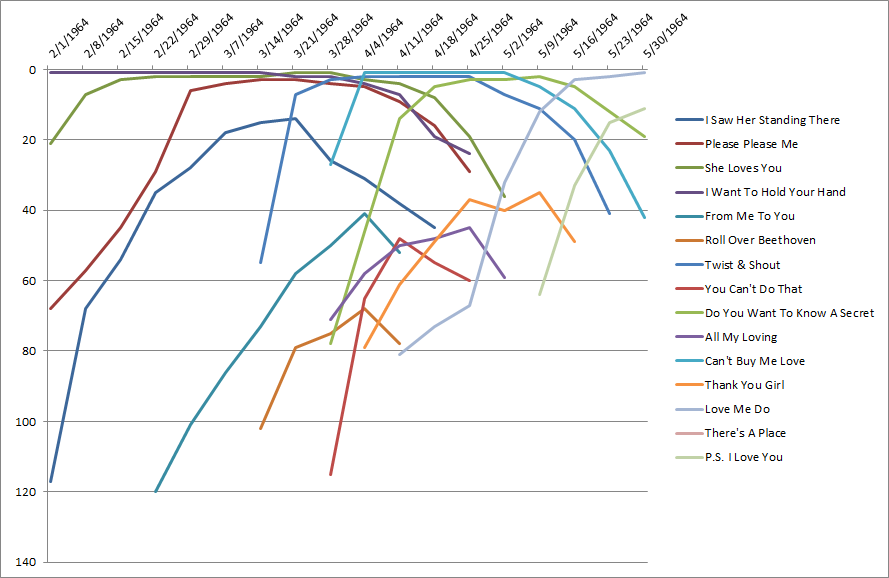
The Beatles occupied the top 5 positions on the charts on April 4, 1964 (no other artist has ever held more than the top 2 spots simultaneously). Not only that, they had an additional 7 singles in the top 100 that week, and 2 other tracks in the top 100 referred to the Beatles in their title!
Scoring a Single’s Success Based on its Chart Run
A natural way to score a single’s success on the charts would be to take an integral to find the area under the curves we’ve drawn. I decided only to count areas where the single was in the top 10. In the below graph, the area of the region above the horizontal line would be found to give the score (more precisely, I took the sum of max(0, 11-chart rank) for each single over all weeks):
Top 15 all time Hot 100 singles: Area Method
- Paper Doll – The Mills Brother (1941)
- Smooth – Santana (1999)
- How Do I Live – LeAnn Rimes (1997)
- Vaya Con Dios – Les Paul & Mary Ford (1941)
- Chattanooga Choo Choo – Glenn Miller & His Orchestra / Tex Beneke & The Modernaires (1941)
- Un-Break My Heart – Toni Braxton (1996)
- We Belong Together – Mariah Carey – (2005)
- Blue Tango – Leroy Anderson (1950)
- The Twist – Chubby Checker (1961)
- Because Of You – Tony Bennett (1951)
- Yeah – Usher featuring Ludacris & Lil Jon (2004)
- Somebody That I Used To Know – Gotye featuring Kimbra (2012)
- All About That Bass – Meghan Trainor (2014)
- Macarena (Bayside Boys Mix) – Los Del Rio (1996)
- Mona Lisa – Nat King Cole (1955)
Top 15 all time Artists: Area Method
- Elvis Presley
- Perry Como
- Mariah Carey
- The Beatles
- Madonna
- Whitney Houston
- Janet Jackson
- Usher
- Michael Jackson
- Boyz II Men
- Patti Page
- Elton John
- Katy Perry
- Dinah Shore
- Stevie Wonder
What’s interesting here?
- Perry Como? I was surprised to see him near the top. Looking at the data, he had a steady string of hits from 1945 – 1958 so perhaps his place on the list is deserved.
- Related to this – why are there three singles high on the list from the 1940s? Technically the Hot 100 did not exist in its current form until late in 1958, however, in the 1940s other charts existed (Best Sellers in Stores, Most Played by Jockeys, and Most Played in Jukeboxes). The data source I’m using goes back to 1940, but it’s not clear to me exactly what source it uses prior to 1958.
- Nothing here would suggest it, but the third highest ranked song, ‘How Do I Live’, while on the charts for 69 weeks, actually never hit the number 1 spot, peaking at #2. So, this method of scoring singles at least tells us something that just looking at the number of weeks a single was ranked at #1 wouldn’t.
Another Scoring Idea: the exponential method
How else can we score a single’s success? Two obvious choices:
- total number of weeks in the Hot 100
- total number of weeks at the #1 spot
These are already easy to look up so I’d prefer something more interesting. What about an exponential function? For some value of p, where p < 0, I consider a single’s score for a given week with rank r to be pr. We score every single each week, and sum up a single’s score across all weeks it was on the chart. As p approaches 0, this approaches the “number of weeks at the #1 spot”. As p approaches 1, this approaches the “total number of weeks in Hot 100”. I’ve chosen three different values of p.
Top 15 all time Hot 100 singles: Exponential Method
| rank | p=0.7 | p=0.9 | p=0.99 |
|---|---|---|---|
| 1 | Paper Doll - The Mills Brothers | Smooth - Santana Featuring Rob Thomas | Radioactive - Imagine Dragons |
| 2 | We Belong Together - Mariah Carey | How Do I Live - Leann Rimes | I'm Yours - Jason Mraz |
| 3 | Smooth - Santana Featuring Rob Thomas | Paper Doll - The Mills Brothers | How Do I Live - Leann Rimes |
| 4 | Vaya Con Dios - Les Paul & Mary Ford | Party Rock Anthem - LMFAO Featuring Lauren Bennett & Goonrock | Party Rock Anthem - LMFAO Featuring Lauren Bennett & Goonrock |
| 5 | Chattanooga Choo Choo - Glenn Miller & His Orchestra / Tex Beneke & The Modernaires | I Gotta Feeling - The Black Eyed Peas | Counting Stars - Onerepublic |
| 6 | One Sweet Day - Mariah Carey & Boyz Ii Men | Macarena (Bayside Boys Mix) - Los Del Rio | Rolling In The Deep - Adele |
| 7 | Un-Break My Heart - Toni Braxton | Vaya Con Dios - Les Paul & Mary Ford | Smooth - Santana Featuring Rob Thomas |
| 8 | Macarena (Bayside Boys Mix) - Los Del Rio | Blue Tango - Leroy Anderson | Sail - Awolnation |
| 9 | I Gotta Feeling - The Black Eyed Peas | Somebody That I Used To Know - Gotye Featuring Kimbra | Before He Cheats - Carrie Underwood |
| 10 | Goodnight Irene - Weavers & Gordon Jenkins | Un-Break My Heart - Toni Braxton | Somebody That I Used To Know - Gotye Featuring Kimbra |
| 11 | I'll Make Love To You - Boyz Ii Men | We Belong Together - Mariah Carey | Need You Now - Lady Antebellum |
| 12 | Because Of You - Tony Bennett | Yeah - Usher Feat Ludacris & Lil Jon | Dark Horse - Katy Perry Featuring Juicy J |
| 13 | I Will Always Love You - Whitney Houston | Dark Horse - Katy Perry Featuring Juicy J | I Gotta Feeling - The Black Eyed Peas |
| 14 | I've Heard That Song Before - Harry James & His Music Makers / Helen Forrest | All About That Bass - Meghan Trainor | Ho Hey - The Lumineers |
| 15 | Yeah - Usher Feat Ludacris & Lil Jon | Too Close - Next | All Of Me - John Legend |
Top 15 all time Artists: Exponential Method
| rank | p=0.7 | p=0.9 | p=0.99 |
|---|---|---|---|
| 1 | Elvis Presley | Elvis Presley | Elvis Presley |
| 2 | Perry Como | Perry Como | Madonna |
| 3 | Mariah Carey | Mariah Carey | Perry Como |
| 4 | The Beatles | Madonna | Elton John |
| 5 | Madonna | The Beatles | Pat Boone |
| 6 | Whitney Houston | Whitney Houston | Taylor Swift |
| 7 | Janet Jackson | Elton John | Stevie Wonder |
| 8 | Usher | Eddie Fisher | Mariah Carey |
| 9 | Boyz II Men | Janet Jackson | The Beatles |
| 10 | Michael Jackson | Michael Jackson | Rod Stewart |
| 11 | The Bee Gees | Patti Page | Michael Jackson |
| 12 | Patti Page | Stevie Wonder | Patti Page |
| 13 | Katy Perry | Usher | The Rolling Stones |
| 14 | Elton John | The Rolling Stones | Nat King Cole |
| 15 | TLC | Katy Perry | Aretha Franklin |
- Notice how which list a song appears on can tell you about what type of success it had. The song ‘Radioactive’ was in the hot 100 for an incredible *87 weeks *(the record) but never hit the #1 spot! As expected it tops the list for p=0.99, and doesn’t appear in the other lists.
- Contrast this to a song like ‘We Belong Together’, which held the #1 spot for 14 weeks, but subsequently fell off the charts quickly, not appearing at all in the list for p=0.99.
- Looking at artists, compare Elton John to The Beatles. The Beatles do better with a lower exponent, while Elton John does better with a higher one, suggesting The Beatles had more high charting hits, but Elton John beat them for quantity of singles with more modest chart success.
- Beatles vs Stones? The Stones get close with p=0.99, but trying a few other p values I don’t see the Stones ever beating the Beatles. In terms of chart success for singles, The Beatles are a clear winner.
Plotting an Artist’s Career
Using one of these scoring functions, we can accumulate the total score of an artist over time. On each of the plots below, the x-axis is time, and the y-axis shows the artist’s total cumulative chart scores at that time. Periods when an artist has more hits should have a steeper slope, and periods when they are absent should appear flat. The accumulated scores use the exponential method with p=0.9. The actual values on the y-axis are unitless but they can be compared across different artists assuming the same scoring function.
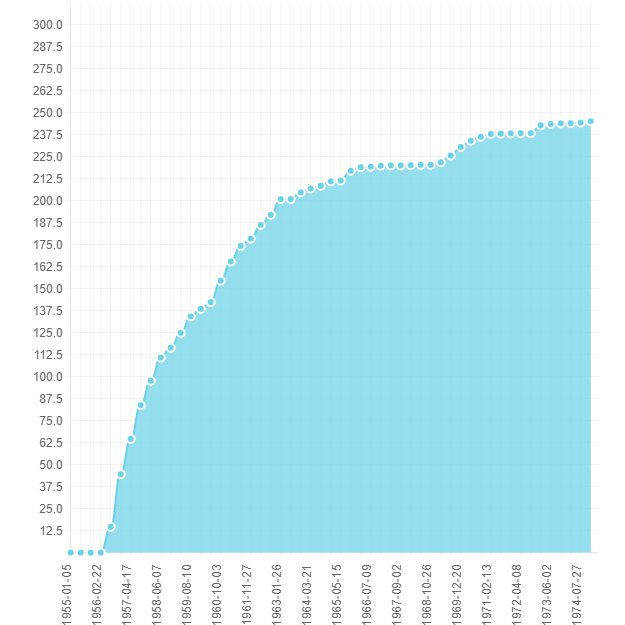
Elvis Presley
An incredible run starting in the mid 1950s, you can see the decline of his chart success starting in the 1960s. There was a small ‘comeback’ in the late 60s corresponding with the so called ’68 Comeback Special’ that aired on NBC and produced a few hits, but it was nothing compared to his earlier chart success.
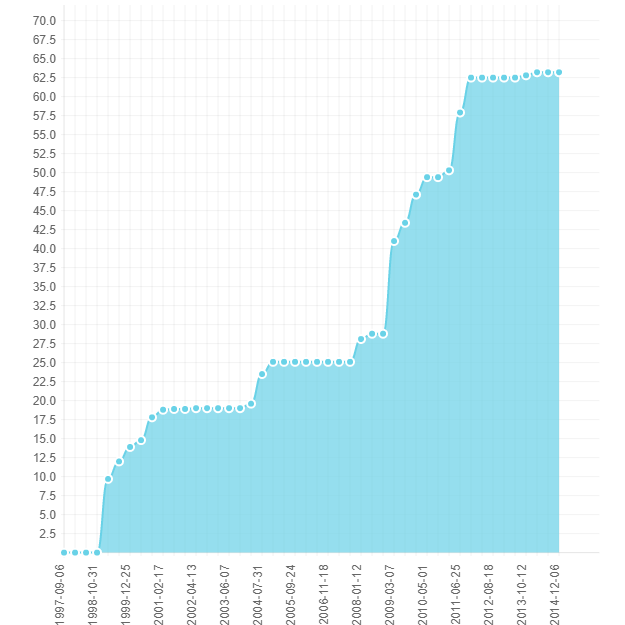
Britney Spears
Britney hasn’t (quite) made it onto any of the top artists list, but her career follows an interesting trajectory. After a meteoric rise in the late 90s with ‘Baby One More Time’ and ‘Crazy’, much of the 2000s was relatively quiet for Britney. The small bump in early 2004 corresponds with her hit ‘Toxic’. In the late 2000s and early 2010s, a series of her releases experienced huge success on the charts, arguably much greater than her original success in the 90s, with three of her four lifetime #1 singles coming out in 2008 or later (Womanizer in 2008, 3 in 2009, and Hold it Against Me in 2011).
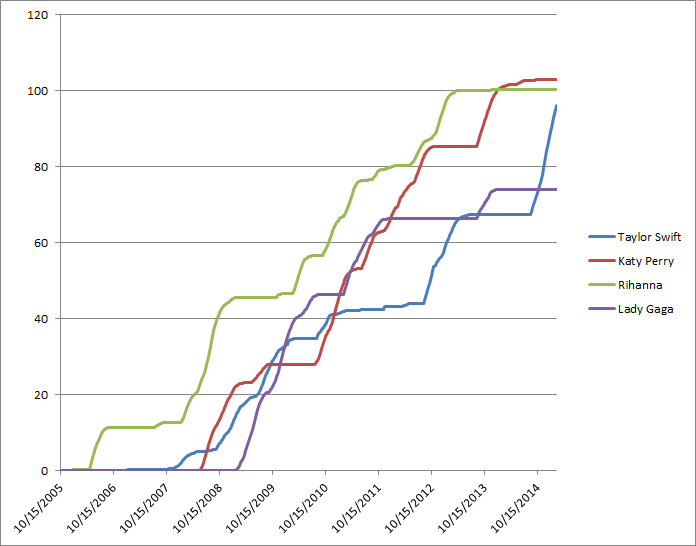
Pop Stars of the 2000s: Rihanna vs Katy Perry vs Taylor Swift vs Lady Gaga
In the mid 2000s several new pop artists emerged simultaneously. I’ve overlaid these four artists’ careers. You can immediately see the recent dormancy of Lady Gaga, and the rise of Taylor Swift in the last three years. For T Swift in particular the two recent steep sections correspond with the release of her last two albums. Katy Perry and Rihanna have been consistent hit makers, though Rihanna has not released an album since 2012.
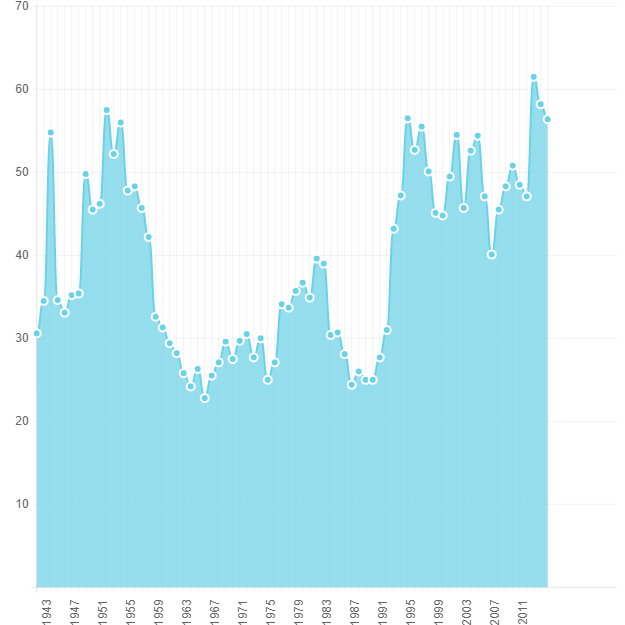
Concentration of Hits
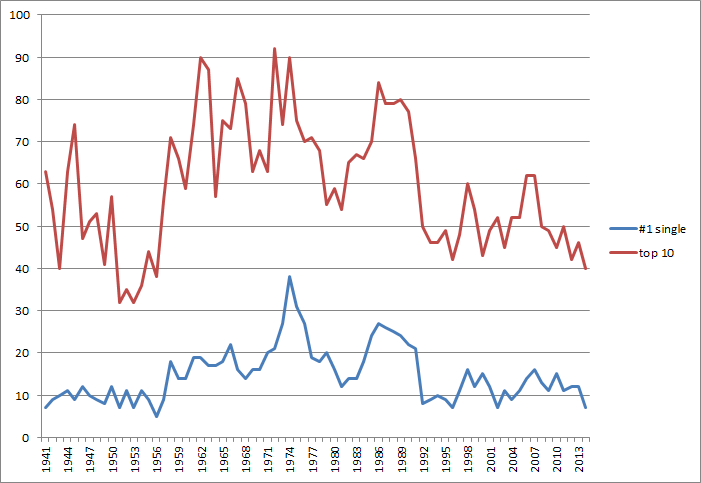
Is there more or less variety in the Hot 100 today than in the past? I considered two ways of measuring this. First, do current singles rise and then disappear more or less quickly than those decades ago? Secondly, even if the rate an individual single rises and falls has remained the same, perhaps there is more concentration in a smaller number of artists. Among the top spots on the Hot 100, do we now see more or less artists represented?
To answer the first question, I used the area method from above to score every single. I then looked only at singles with a positive score (appeared at least once in the top 10). For each year, I took the average score of all singles from that year. A high average should suggest singles from that year tended to stay in the top 10 longer, and vice versa. Nothing conclusive, but it does appear a bit lower from 1960-1990 than the last 25 years.
To answer the second question, for each full year in the data I computed two values. The first was the total number of distinct artists to appear in the top 10, and the second was the total number of artists to have singles that hit #1. Both are plotted below. Again nothing earth shattering, but it seems consistent with Billboard diversity peaking during the 1970s and remaining lower since the early 90s.
Methods & Caveats
All of the data was retrieved by scraping the Ultimate Music Database website. Python code is below. After gathering the data, I did all work in Excel. The size of the dataset is ~300k rows, which is still small enough for Excel to handle (with some help from VBA). A few issues did become obvious while working with it:
- Beatles vs. The Beatles: both versions appeared in the data, and similarly for many other artists. For any artist where I found names of X and The X, I replaced all instances with The* X*.
- Spelling errors/other different spellings: I happened to notice that the Britney Spears song ‘Oops … I did it again’ also appeared as ‘Oops! … I did it again’. Unfortunately these strings don’t precisely match up, and the simple fix of making everything lower/upper case doesn’t fix it. I noticed a few spelling errors as well and there are surely many I didn’t notice.
- Multiple artists appearing on a track: For any track with multiple artists, the score did not contribute to the career scores for *any *of the artists involved. Partially this was due to uncertainty about how to handle it (divide the score between them? count the score fully for all artists involved? how much less should it count to be a featured artist as opposed to a lead artist?). The other issue comes from the data itself. Consider these artist strings that appear in the data: - Bing Crosby & John Scott Trotter & His Orchestra
- Nicki Minaj featuring Drake, Lil Wayne & Chris Brown
- Peter, Paul and Mary
- Daryl Hall & John Oates
- It gets tricky fast. The ampersand is sometimes used to divide distinct artists, is sometimes part of the name of the artist, and in some cases a single track uses it with both meanings! The comma is no better – it can also be a divider or part of an artist name! Maybe this could be addressed but for now I skipped it.
I’d love to create an interactive tool for generating these types of graphs dynamically, but I currently lack the Javascript ability to do so in any reasonable time. Instead I’ve uploaded all the raw data here, in PSV format (as mentioned song names/artists sometimes have commas, but none so far have featured a pipe character) so feel free to have at it.
Scraping Code
Fortunately everything on the Ultimate Music Database is nicely formatted in HTML tables, so pulling it out using the python Beautiful Soup library is not too difficult. A small note – using the default python html parser did not work, but BeautifulSoup docs suggested using html5lib, which fixed the problem. Code is available on Github.
