Comparing Algorithms for Dispersing Overlapping Rectangles
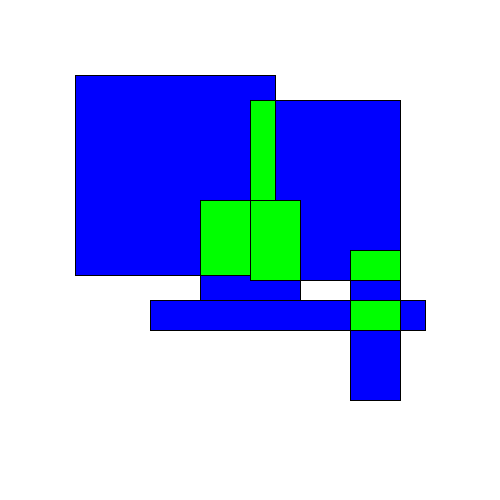
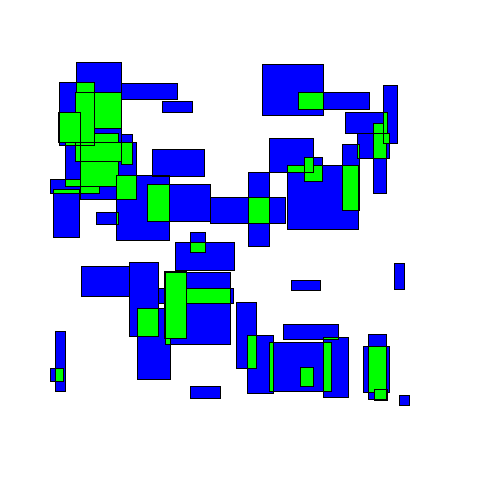
What do we mean by dispersing overlapping rectangles? The idea is to take a set of overlapping rectangles:
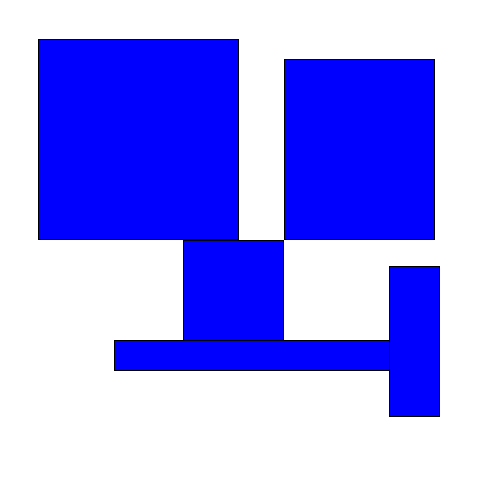
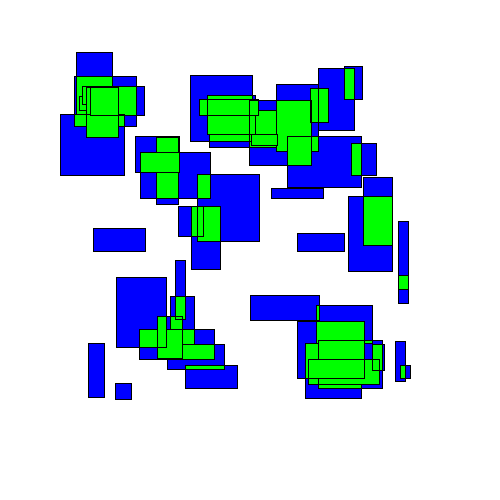
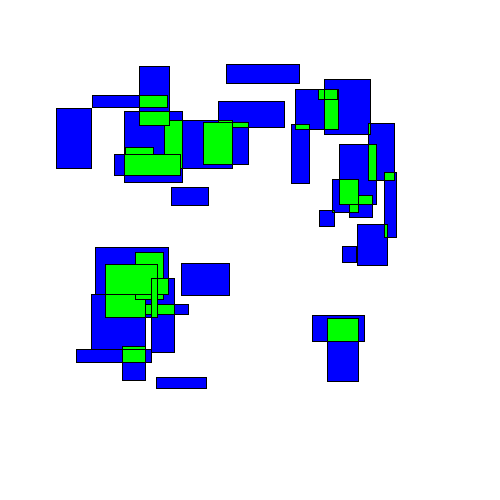
Then spread them out in some way ('disperse' them) so that they no longer overlap:
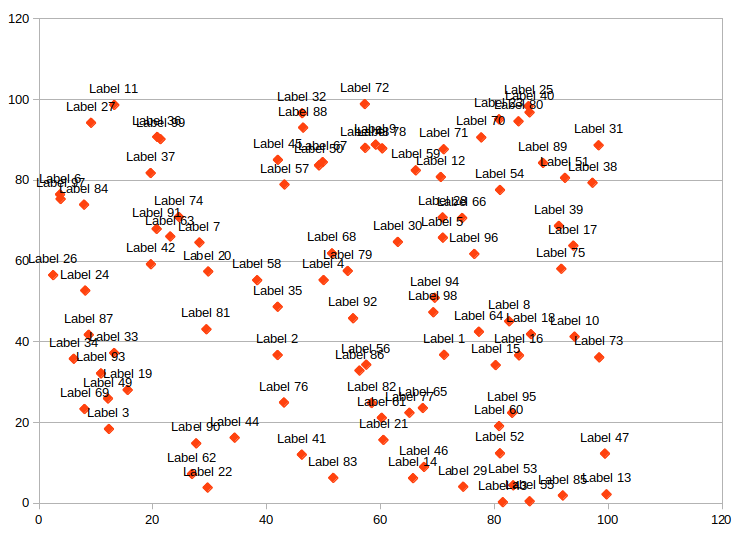
When might we care to do this? I first saw this problem in the context of placing labels on a graph. Any kind of graph (e.g. a bubble chart, scatter plot, etc.) where each item has some text associated with it may have issues with labels overlapping. Most programs for generating these types of graphs (e.g. Excel) do not automatically prevent the labels from overlapping:
Maps with many features to label face a similar challenge. The general problem is referred to as automatic label placement (or point-feature label placement)
Questions on this topic are common[1]. If you browse through these questions, you won't find any easy solutions. Finding the optimal solution (measured, for example, as minimizing the total movement of rectangles from their original positions) is an NP-complete problem[2].
This problem has been tackled comprehensively by researchers. This is the best paper I found comparing performance for a variety of algorithms. Below, I implemented and compared some of these algorithms myself.
Greedy Algorithms
I decided to use Python and to visualize the results using Pygame. The first class of algorithms I looked at were greedy algorithms.
The most naive greedy algorithm I could think of was starting at the top of a group of rectangles and working down, shifting rectangles downwards as needed to avoid overlapping any rectangles above them. I'll call this the TopDown approach. Here's an animated example:
You can immediately see that some rectangles end up getting moved far from their original location.
A slightly smarter greedy algorithm might shift rectangles left or right in addition to up and down to prevent overlap. It also might start not at the top, but instead choose which rectangles to shift in a more intelligent way. One option would be to choose to shift rectangles with the maximum overlap first. Here is pseudocode for what I call the WorstFirst approach:
while has_overlaps(rectangles):
    overlaps = get_all_overlaps(rectangles)
    max_overlap = choose_max_overlap(overlaps)

    # This shifts one of the overlapping rectangles either down or to the
    # right to fix the overlap - whichever distance is smaller
    fix_overlap(max_overlap)
Here's an animated example:
Visually we can see an immediate improvement from the TopDown approach.
Of course, this type of greedy algorithm could be generalized. You could choose to fix the smallest overlap instead of the largest, the overlap closest to the center, the rectangle overlapping the most other rectangles, or use some other metric to make the choice. Regardless, the basic structure of the greedy algorithm would remain the same.
Separation Behavior
Other approaches can do better than a greedy algorithm. In the Separation algorithm, we iteratively move all the rectangles simultaneously at a certain velocity which is determined by how they overlap with other rectangles. The determination is made based on what is called 'Separation Behavior', originally described, as far as I can tell, for 'Boids' (this approach also has similarities to the Hirsch algorithm described in the paper referenced above).
Here is pseudocode for this behavior:
while has_overlaps(rectangles):
    # First, generate a vector for each rectangle
    # based on it's overlap with other rectangles
    overlap_vectors = []
    for each r in rectangles:
        v = generate_normalized_overlap_vector(r)
        overlap_vectors.append((r, v))

    # Then, translate each rectangle by it's overlap vector
    for each r, v in overlap_vectors:
        translate_rectangle_by_vector(r, v)
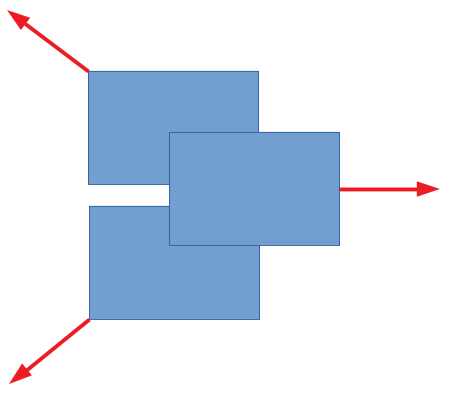
The overlap vectors are oriented so that overlapping rectangles will move away from eachother. Here's an example of overlap vectors with 3 rectangles:
The resulting movement looks as follows:
As we'll see below, this approach performs better than either of the greedy algorithms. Intuitively this makes sense, as this approach seems to take on a more 'holistic' view of the entire space.
Simulated Annealing
Finally, I tried implementing a simulated annealing algorithm. This type of algorithm excels at finding global maximums where other algorithms (for example, greedy algorithms, or an algorithm like gradient descent) may only find local maxima. The approach I've used was inspired by this paper, which was explained further in this blog post.
The pseudocode for simulated annealing is a bit more complex:
temperature = INITIAL_TEMP

while has_overlaps(rectangles):
    energy = compute_energy(rectangles)

    new_rectangles = make_random_adjustment(rectangles)

    new_energy = compute_energy(rectangles)

    # We randomly choose whether to accept the new arrangement or not
    # The choice to accept depends on the change in energy and current
    # temperature
    if random(0, 1) < e ^ ((energy - new_energy) / temperature):
        rectangles = new_rectangles

    temperature = temperature - COOLING_RATE
In the pseudocode above, the compute_energy function I chose was simply the total area of overlap of all rectangles. Over time, the algorithm will tend to slowly decrease the 'energy' of the arrangement, which in this case results in less rectangle overlap.
In addition, by slowly reducing the temperature parameter, it gradually becomes less likely for changes that increase 'energy' (in this case, cause more overlap) to be accepted as the annealing process continues. That is the purpose of the exponent containing the temperature parameter.
The choice of make_random_adjustment function is also important. In my implementation, 50% of the time this was a random translation of the rectangle, and 50% of the time this was a random rotation of the rectangle around the axis of it's original position. In testing, adding this 'rotation' option seemed to improve the results.
Visually, this looks like rectangles being randomly perturbed until eventually finding an equilibrium:
The final results may look similar to the results from the 'separation' strategy, but the path to get there is very different.
Comparison
So, which approach works the best, and how much better can we do than the most naive greedy algorithm?
Many factors will affect this: the total number of rectangles, their size, distribution, etc. All of these algorithms can also be adjusted in different ways (for example, the velocity for the separation algorithm, or many of the parameters in the simulated annealing algorithm).
I chose a fixed set of parameters and ran each algorithm for 1000 iterations, then compared the results. Roughly, the parameters chosen were 50 randomly generated rectangles on a 500 x 500 unit space, with each rectangle having width and height between 10 and 75. The 'score' of each iteration was equal to the total distance all rectangles had moved from their original locations when all overlaps were eliminated.
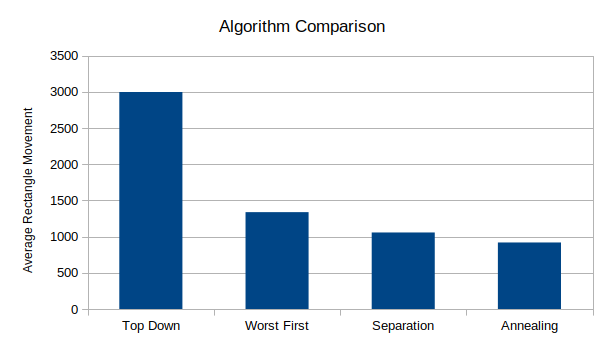
As expected, the most naive TopDown approach performs the worst by far. Separation and Simulated Annealing perform the best, with annealing averaging about 15% better than the separation algorithm for this particular set of parameters. These results are roughly consistent with those in the paper mentioned earlier (see here), where simulated annealing also performed best.
Implementation
The code is available on Github. For visualization, I used Pygame. Generating the GIFs was done with Imageio and pygifsicle.
Improvements
In many of the algorithms above, we are doing O(n^2) work on each iteration to check which rectangles are overlapping which other rectangles. It should be possible to use a more optimal data structure than just a list to improve the runtime complexity of these kinds of tests. Specifically, it would make sense to use a data structure that groups elements based on their spatial relationships, like an R-Tree.
Other data structure improvements might be possible for other algorithms. For example, it might be possible to implement some kind of Priority Queue approach for greedy algorithms (with the 'priority' of a given rectangle in the queue being equal to it's total overlap with the other rectangles, for example).
Significantly more effort could be made to improve the parameters for simulated annealing. The initial temperature, change in temperature, the type of random changes made, etc., could all be adjusted, and I imagine the right combination of changes might significantly improve the results.
Some examples of related questions online include:
- https://stackoverflow.com/questions/3265986/an-algorithm-to-space-out-overlapping-rectangles
- https://stackoverflow.com/questions/6750377/move-rectangles-so-they-dont-overlap
- https://stackoverflow.com/questions/48427876/highcharts-is-it-possible-to-show-all-data-labels-in-a-bubble-chart-without-the
- https://highcharts.uservoice.com/forums/55896-highcharts-javascript-api/suggestions/15960472-collision-detection-for-data-labels
- https://stackoverflow.com/questions/8770429/excel-macro-to-fix-overlapping-data-labels-in-line-chart
A proof of the NP completeness can be found in the paper 'The Computational Complexity of Cartographic Label Placement', available here, though the problem formulation is not identical. ↩︎
