Aerial Bombing of Cities in WW2
The invention of the airplane at the start of the 20th century, and the subsequent introduction of air raids and strategic bombing in warfare led to devastating results.
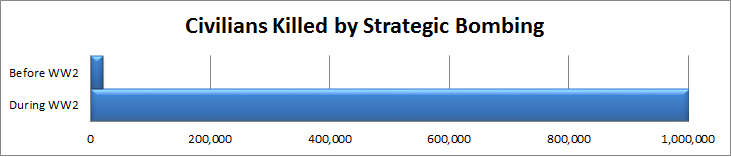
After listening to the excellent Hardcore History podcast by Dan Carlin discussing the context and story behind the dropping of atomic bombs at the end of WW2 (see here), I was struck by some of the numbers involved. Before WW2, only about 20,000 people had ever died as a result of bombs being dropped from the air[1]. Some of these early air raids seem ludicrous in hindsight. In 1915, as WW1 began to enter the extended stalemate of trench warfare, the Germans actually used Zeppelins(!) to bomb different locations in the United Kingdom (and ultimately stopped as the Zeppelins proved too vulnerable). The British and French also executed their own limited bombing raids.
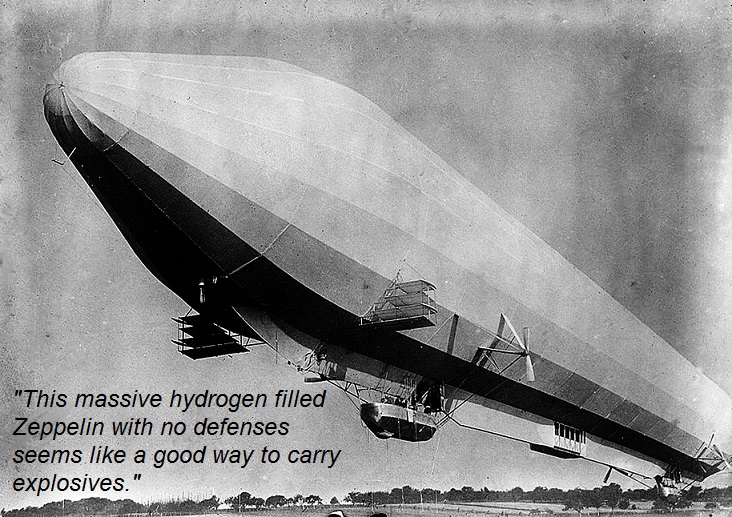
(picture from here)
The idea of Zeppelins dropping bombs on cities now seems absurd, but had I looked up at the time to see a giant enemy airship filling the sky, it’s hard to imagine not feeling helpless and afraid. Though no more than a few thousand people died worldwide from bombing raids in WW1, it traumatized citizens, and was the first step towards massive aerial bombing in WW2.
Between the world wars, many air theorists believed that aerial bombings would be a decisive factor in the next large scale conflict. Giulio Douhet, an Italian air theorist, was a major proponent of bombing, believing it might be used to win a war quickly. Here is a simplified outline of how Douhet believed a war would proceed:
- Build a massive, overpowering air force
- When war breaks out, immediately launch devastating attacks against populated enemy cities
- The morale of the citizens will deteriorate
- The citizens will rise up against the government and demand peace
- You win the war
One great benefit – the war will be short! One devastating attack against Berlin or London, and the people are sure to rise up and demand peace! After prolonged and deadly trench warfare in the first world war, anything that kept the war shorter was worth considering. Not only that, if you don’t follow this plan the enemy will! In 1932 Stanley Baldwin, a British politician, said in regards to aerial warfare:
“…the bomber will always get through, the only defence is in offence, which means you have to kill more women and children more quickly than the enemy if you want to save yourselves…”
World War 2
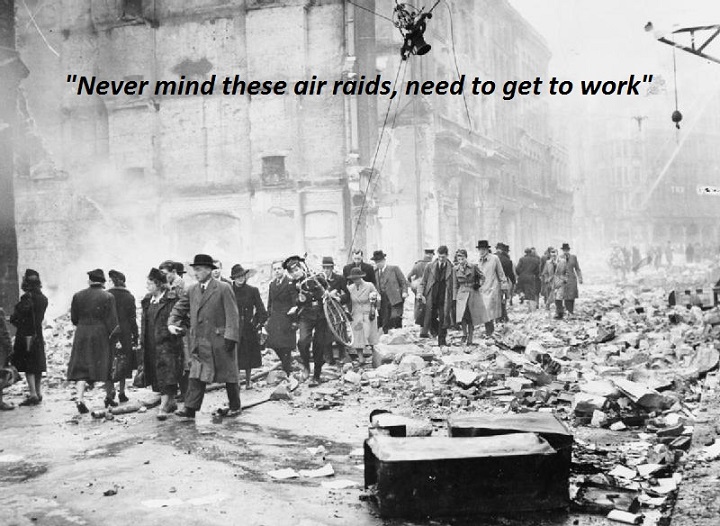
After WW2 broke out and bombing raids began, the ideas of Douhet and others were put to the test, and they were very wrong. The German Luftwaffe began the London Blitz in September of 1940. While about 40,000 civilians were killed, morale of Londoners did not collapse, and there was no general uprising demanding peace.
(picture from here)
If not the British, perhaps German morale could be crushed under sufficient bombing! Britain’s “Bomber” Harris certainly believed so, stating:
“There are a lot of people who say that bombing can never win a war. Well my answer to that is that it’s never been tried yet and we shall see.”
Harris led British bombing attacks on German cities starting in 1942, which at times included thousands of planes in individual raids. He viewed these attacks as retaliation for earlier German attacks, and believed that enough bombing would force the German surrender. He has since faced criticism (along with others, and the entire system of aerial bombing), particularly for the destruction of cities later in the war. In February 1945, he said:
“I do not personally regard the whole of the remaining cities of Germany as worth the bones of one British Grenadier.”
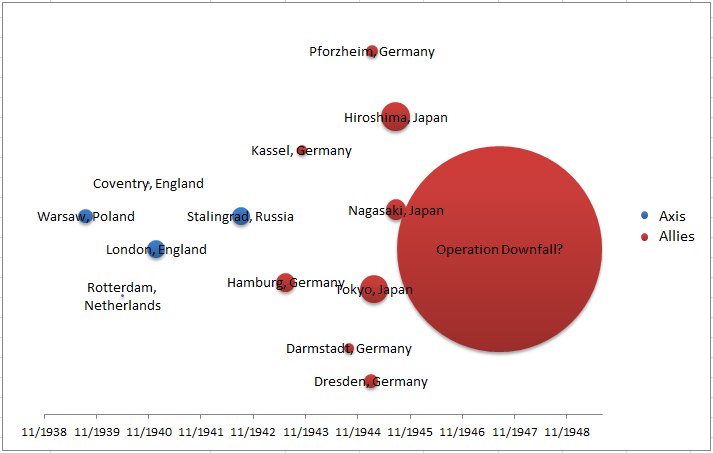
Despite these campaigns and later with the help of the United States, German morale did not collapse from the bombing, nor did that of the Japanese. The chart below is my attempt to visualize the human cost of the major air raids on cities during of the war. If you have not seen a bubble chart like this before, each bubble is positioned along the x-axis based on the date it happened, and the size of the bubble indicates the (estimated) number of civilians killed. They are spread out vertically simply to keep them from overlapping.
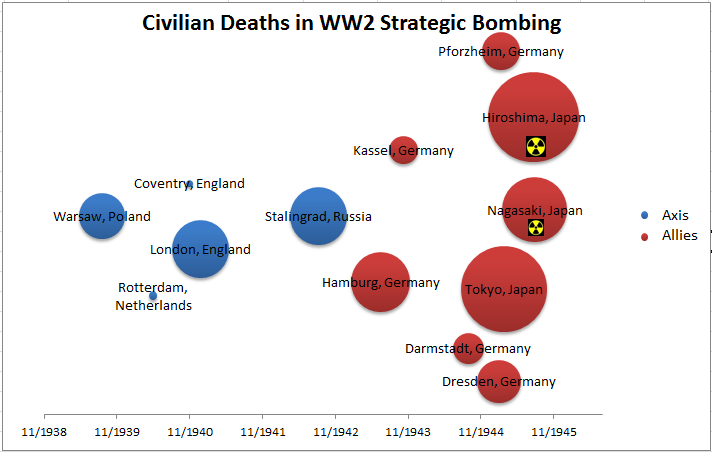
A few caveats:
- The Warsaw bombing was not exclusively an air raid, with damage also coming from artillery and street fighting, but aerial bombing was a major component.
- The bombing of London was more spread out (over about 8 months) than most of the others shown.
- There were other major bombing raids that took place, for instance allied bombing of Berlin, which was spread out over the entire war and I’ve chosen not to show.
- I’ve also chosen not to display the numbers of casualties and only focus on the relative size of these bombings.
However, I hope this graphic can help to tell the story:
- While the Axis (in particular the German Luftwaffe) dominated the first half of the war, the Allies (RAF and USAAF) dominated the second half, when the Luftwaffe was kept busy with the Defence of the Reich.
- The Tokyo fire bombing, on March 9, 1945 (Operation Meetinghouse), is believed by some to be the single most deadly air raid of the war[2]. Estimates vary widely, and measuring casualties in the nuclear attacks is made more difficult when trying to account for later effects of radiation, but at the very least it was on par with Hiroshima.
- Allied bombings starting at the beginning of 1945 were concentrated and devastating until the end of the war.
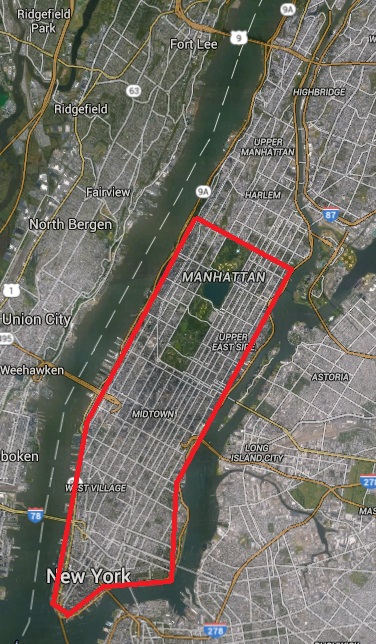
I’ve left out much of the story, for instance the incredible inaccuracy of these bombs (particularly early in the war), which were often many miles off of target, and how this contributed to the targeting of large urban areas. None of this has mentioned the massive areas destroyed in these bombing raids. Sixteen square miles of Tokyo burned to the ground in the 1945 firebombing – an area nearly the size Manhattan.
Some of this might help us at least understand the dropping of atomic bombs, if not justify it. Henry Stimson of the US said (paraphrasing), “The only reason I approved the atomic bomb was because I believed it would stop the firebombing.” At the same time plans were being made to drop these bombs, the US military was making plans for a full scale invasion of Japan (Operation Downfall). General Lauris Norstad estimated it would cost “half a million” US lives. A study by American physicist William Shockley estimated “400,000 – 800,000 killed“, and “we shall probably have to kill 5 to 10 million Japanese“. This certainly changes the bubble chart.
Is it OK to kill a few hundred thousand civilians, to possibly save millions? At the post war Nuremberg trials, Germans questioned whether the mass bombing of civilians by the Allies constituted a war crime. Carlin argues that they were – but that through the course of the war they had become accepted. At Nuremberg the chief counsel said in response:
“The ruin of German and Japanese cities were the result not of reprisals, but of deliberate policy, and bore witness that aerial bombardment of cities and factories has become a recognized part of modern warfare as carried on by all nations.”
These questions of morality and the weighing of some lives versus others are the kinds of ‘Logical Insanity’ questions Dan Carlin discusses in his podcast. If you find these questions interesting or want to hear more firsthand accounts about the experience of living through these aerial bombings, I would highly recommend it (here).
Thoughts on Data Visualization
Taking rows of data and turning into a chart does not suddenly make it interesting. Someone tasked with creating a graphic on civilian casualties of various air raids might dutifully transform a dull list of numbers into an equally dull chart:
This chart is terrible. The labels are far from the data they represent. We’ve totally discarded the timeline. Comparing the relative quantities is difficult. Whatever we choose to do with the data, we’ll always suffer from Stalin’s maxim “one death is a tragedy; a million deaths is a statistic”, but this does not mean we shouldn’t organize and make an effort to display those statistics in the best possible way. A million deaths do not happen in a vacuum, and to display them carelessly is just disrespectful.
When looking at the data behind air raids in WW2, a few things struck me:
- Most air raids early in the war were done by the Axis, and essentially all later in the war by the Allies
- The concentration of air raids in the last year of the war
- The scale of the Tokyo bombing (and other firebombing) relative to the more well known atomic bomb attacks
By identifying the interesting parts first and then trying to create something to reflect it, I think I got a better result.
- Colors for the Axis/Allies
- Use of bubble chart for easier comparison of relative sizes
- Use of the x-axis to show position of the events in time
At the same time, I worried about trying to do too much at once. Originally I planned to show all the major conflicts of WW2 on one graphic, with each circle partially shaded to show the fraction of casualties on either side. Quickly I realized this would obscure the hope of making any individual point clear. Leaving off specifics like the exact dates and number of casualties was also an attempt to reduce clutter.
Better data visualization can help us understand the how and the what of the war, and even hint at the why (as I tried to show with the decision to drop the atomic bombs). But to understand the data is not to understand the war. Nothing in the numbers relates the experience of someone on the ground that lived through a fire raid, which is why other sources (e.g. first hand accounts, or artistic interpretation in books and film) are critically important.
References
Most of this is taken from the Hardcore History podcast by Dan Carlin (linked again here).
The wikipedia page on Civilian Casualties of Strategic bombing has a good overview of the data I used for the graphics. I attempted to increase my confidence in these numbers by digging a little further into the sources (and comparing against e.g. the podcast), but in most cases casualty estimates are vary widely, and I intentionally tried to keep specific numeric claims to a minimum.
This is necessarily an estimation. Major components of the sum include WW1 bombings, bombings in the Spanish Civil War (including e.g. Guernica that inspired the Picasso painting), and bombings in the early Sino-Japanese War that later became part of WW2. There were also some bombs used in wars fought for European colonialism. ↩︎
Estimates vary from 75,000 to 200,000 killed. This article claims 100,000 ↩︎
